[Azure Monitor] Collecting Linux data using custom JSON data source

![[Azure Monitor] Collecting Linux data using custom JSON data source](/content/images/size/w2000/2024/02/trending-on-artstation--1-.jpg)
In order to collect custom JSON data with OMS log Analytics you should have at least OMS Agent for Linux V1.1.0-217. In this post, we will be installing the latest version.
For this blog I am using Ubuntu 16.04 LTS running in Microsoft Azure, but you can use any of the supported Linux Operating systems. You can check the supported Operating Systems from Supported Linux Operating Systems
Downloading and Installing OMS Agent for Linux
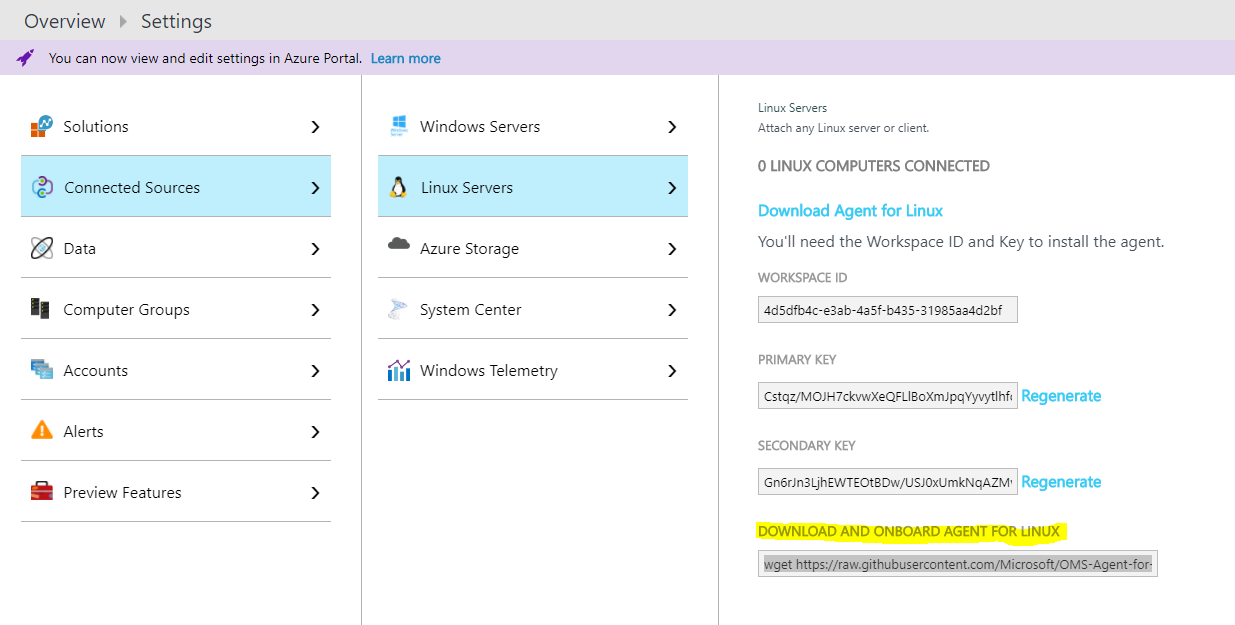
Open your workspace and go to Settings > Connected sources > Linux servers > and copy the "Download AND ONBOARD AGENT FOR LINUX"
run the command in your linux VM and make sure it has completed successfully.
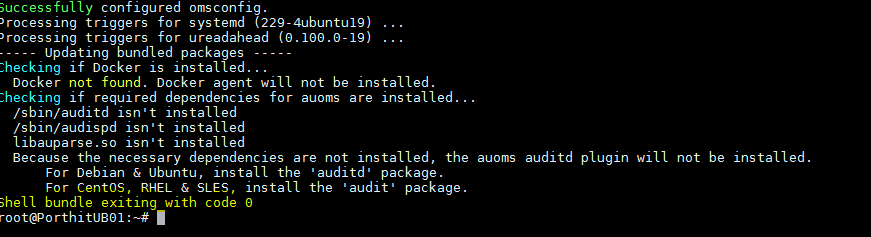
If you've seen Shell bundle exiting with code 0 then this means that the agent was installed successfully and after a few minutes you should see the agent in the connected Linux computers.
You can also confirm the VM is sending heartbeat with the below query in your log analytics workspace:
Heartbeat | where OSType == 'Linux'In this example I've prepared a shell script that will collect some server details like Hostname, IPAddress, Memory..etc and it will print the output in JSON format. We will be capturing the output of the script by the OMS Agent.
# Get VM Hostname

hostname=`hostname` 2> /dev/null


# Get Linux Distribution

distro=`python -c 'import platform ; print platform.linux_distribution()[0] + " " +        platform.linux_distribution()[1]'` 2> /dev/null


# Get Server uptime

if [ -f "/proc/uptime" ]; then

uptime=`cat /proc/uptime`

uptime=${uptime%%.*}

seconds=$(( uptime%60 ))

minutes=$(( uptime/60%60 ))

hours=$(( uptime/60/60%24 ))

days=$(( uptime/60/60/24 ))

uptime="$days days, $hours hours, $minutes minutes, $seconds seconds"

else

uptime=""

fi


# Get VM private IP Address

IPAddress=`ip addr | grep 'state UP' -A2 | tail -n1 | awk '{print $2}' | cut -f1  -d'/'` 2> /dev/null


# Get VM Public IP Address

PublicIP=`wget http://ipecho.net/plain -O - -q ; echo` 2> /dev/null


# Get the number of CPUs

NumberOfCPUs=`grep -c ^processor /proc/cpuinfo` 2> /dev/null


# Get the Average CPU Load

CPULoad=`top -bn1 | grep load | awk '{printf "%.2f\n", $(NF-2)}'` 2> /dev/null


# Get the total Memory

TotalMemoryMB=`grep MemTotal /proc/meminfo | awk '{print $2}'` 2> /dev/null


# Get percentage of memory in use

MemoryInUse=`free | grep Mem | awk '{print $3/$2 * 100.0}'` 2> /dev/null


# Get percentage of free memory

FreeMemory=`free | grep Mem | awk '{print $4/$2 * 100.0}'` 2> /dev/null


printf '{"hostname":"%s","distro":"%s","uptime":"%s","IPAddress":"%s","PublicIP":"%s","NumberOfCPUs":"%s","CPULoad":"%s","TotalMemoryMB":"%s","MemoryInUse":"%s","FreeMemory":"%s"}\n' "$hostname" "$distro" "$uptime" "$IPAddress" "$PublicIP" "$NumberOfCPUs" "$CPULoad" "$TotalMemoryMB" "$MemoryInUse" "$FreeMemory"
In this example, I've placed my script in /var/www/html but feel free to change it to anywhere else accessible by the omsagent user. additionally, you can make the omsagent and omiusers group the owner of the script by running the below:
sudo chown omsagent:omiusers /var/www/html/serverdetails.shMake the script executable by running the below command:
chmod +x /var/www/html/serverdetails.shThe custom data sources can be simple scripts returning JSON such as curl or one of the FluentD Plugins, In our example we will be using exec Input Plugin.
Create a new configuration file serverdetails.conf in the OMS Agent additional configuration directory to store our configuration file.
nano /etc/opt/microsoft/omsagent/YorWorkspaceID/conf/omsagent.d/serverdetails.confIn order to collect JSON data in Log Analytics, we will need the following
- We will need to add oms.api. to the start of a FluentD tag parameter in an input plugin. This will also be used when searching for your data in Log Analytics, For example, the custom tag
tag oms.api.serverdetails will have a record type of serverdetails_CL
- In the command type in your command to execute and return a JSON output, in this example we will call our script located on /var/www/html/serverdetails.sh.
- Format: should be json
- interval - is the interval to run the script.
Note: Make sure to change YourWorkspaceID path to reflect your actual workspace ID in Buffer_path parameter.
 <source>
  type exec
  command 'bash /var/www/html/serverdetails.sh'
  format json
  tag oms.api.serverdetails
  run_interval 30s
</source>


<match oms.api.serverdetails>
  type out_oms_api
  log_level info
  buffer_chunk_limit 5m
  buffer_type file
  buffer_path /var/opt/microsoft/omsagent/YourWorkspaceID/state/out_oms_api_serverdetails*.buffer
  buffer_queue_limit 10
  flush_interval 20s
  retry_limit 10
  retry_wait 30s
</match>
Now that we've created our configuration file, we will need to change the ownership of this file to the omsagent user and omiusers group.
sudo chown omsagent:omiusers /etc/opt/microsoft/omsagent/YourWorkspaceID/conf/omsagent.d/serverdetails.confTo confirm the ownership has changed type:
ls -l /etc/opt/microsoft/omsagent/YourWorkspaceID/conf/omsagent.d/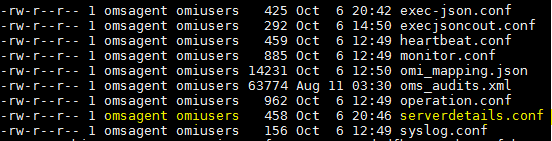
Restart the oms agent by running the following:
sudo /opt/microsoft/omsagent/bin/service_control restartOnce you restart the agent, the OMS agent should capture the new configuration file located in omsagent.d directory. To confirm you can check the omsagent log file located on
/var/opt/microsoft/omsagent/YourWorkspaceID/log/omsagent.log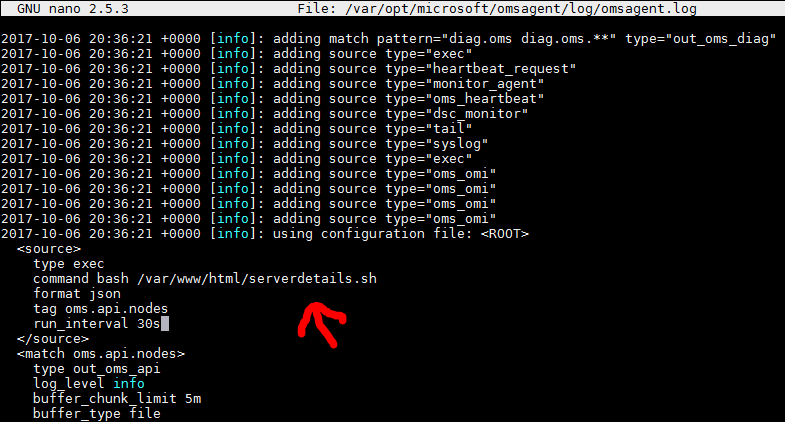
If you've any errors it will also listed in the same log file, so back and check your configuration. If all of your configurations are correct, in a few minutes you should start seeing your data in Log Analytics.
Viewing your data in Log Analytics
The data will be collected in Log Analytics with a record type of the FluentD tag parameter. In our case it is
serverdetails_CL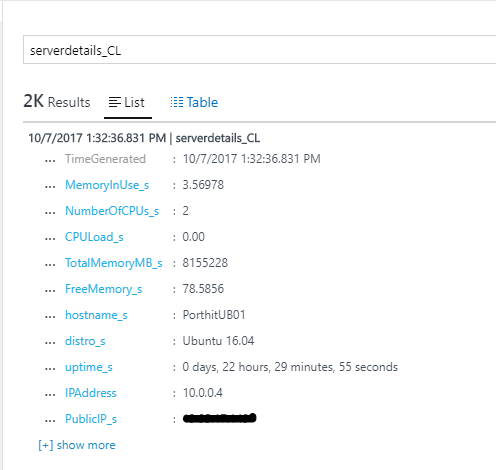
- Records may take a while to be converted into custom fields. Once they are created, you will be able to see them in the custom fields blade.
- All values returned by JSON has a data type of System.String so you cannot query something like
serverdetails_CL | where CPULoad_s > "50"and you will get "Cannot compare values of types string and string. Try adding explicit casts". But you can search for it as a string value for example:
serverdetails_CL | where IPAddress contains "10.0.0"