Configuring and troubleshooting Linux Syslog in Azure Monitor [Part2]

![Configuring and troubleshooting Linux Syslog in Azure Monitor [Part2]](/content/images/size/w2000/2023/10/DALL-E-2023-10-22-11.50.20---Illustration-of-a-technician-at-a-workstation--intently-analyzing-the-Linux-syslog-on-a-monitor.-Beside-the-monitor--a-cloud-graphic-with-the-Azure-lo-1.png)
In the previous article, we've configured rsyslog on CSSRedhat02 to forward syslog data to our OMSAgent running on CSSRedhat01. In this article, we will trace the data flow and confirm the data has reached our log analytics workspace.
So when you are troubleshooting syslog data collection, there are a couple of questions:
Is CSSRedhat02 is actually sending data to CSSRedhat01 ?
My favorite tool for this is TCPDump, since we are sending data from CSSRedhat02 to CSSRedhat01 on 514 UDP, we can start a trace from CSSRedhat01 to monitor data coming from outside to port 514 UDP.
The command should be:
tcpdump -n udp port 514 -i eth0 -vI will start the trace and see if we can capture any data:
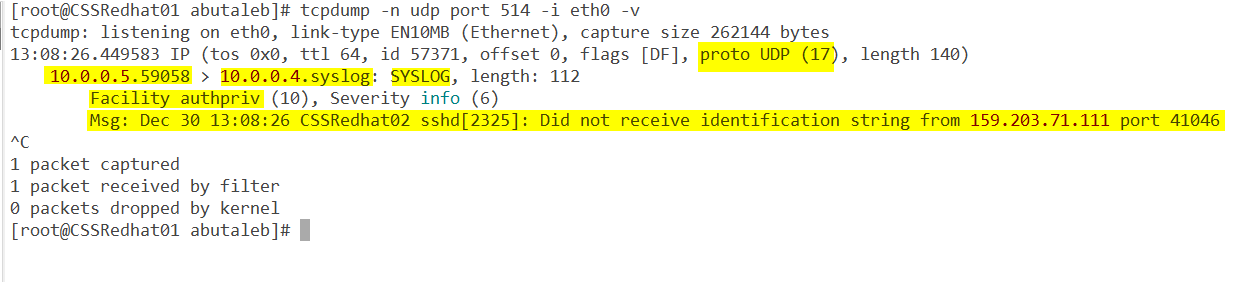
- Great, so we can see data coming from 10.0.0.5 which is CSSRedhat02 vm
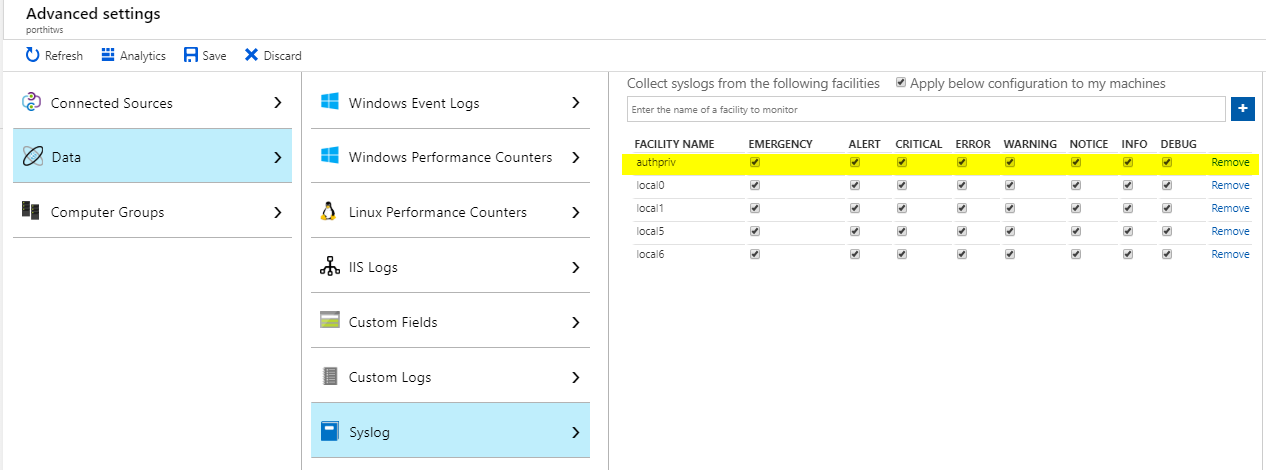
- Facility is authpriv, hmm.. did we actually enabled that on log analytics ? in our case the answer is no as we only added local0, local1, local5, and local6. So we will need to add it if we are interested in authpriv data.
Can we see data from CSSRedhat02 in CSSRedhat01 /var/log/messeges ?
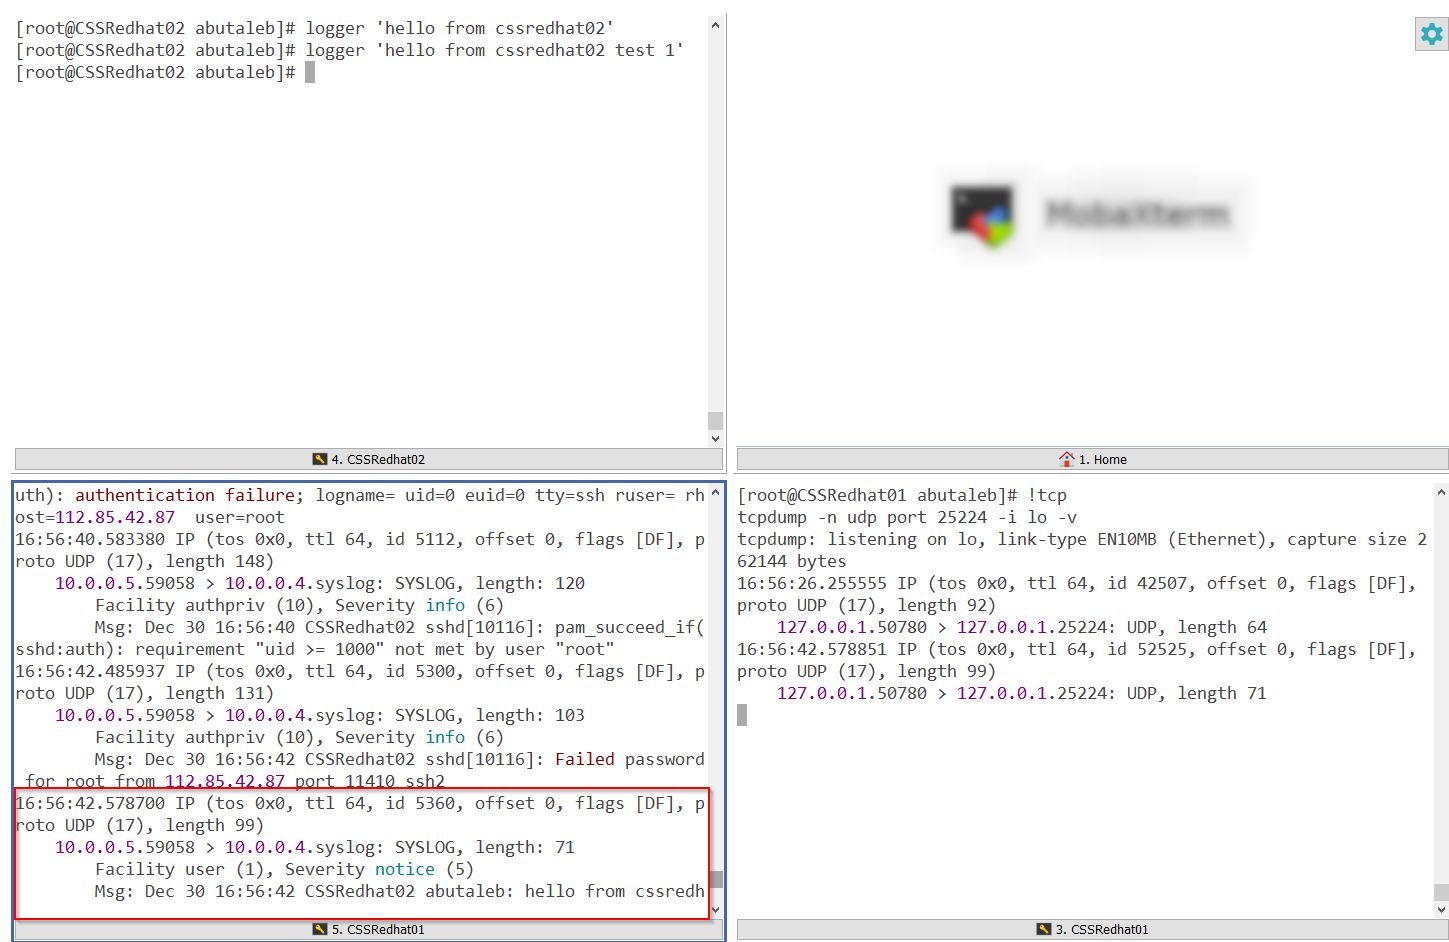
We can use logger tool to write a sample data in CSSRedhat02 and then confirm if the data is showing there /var/log/messeges in CSSRedhat01.
logger 'hello from CSSRedhat02'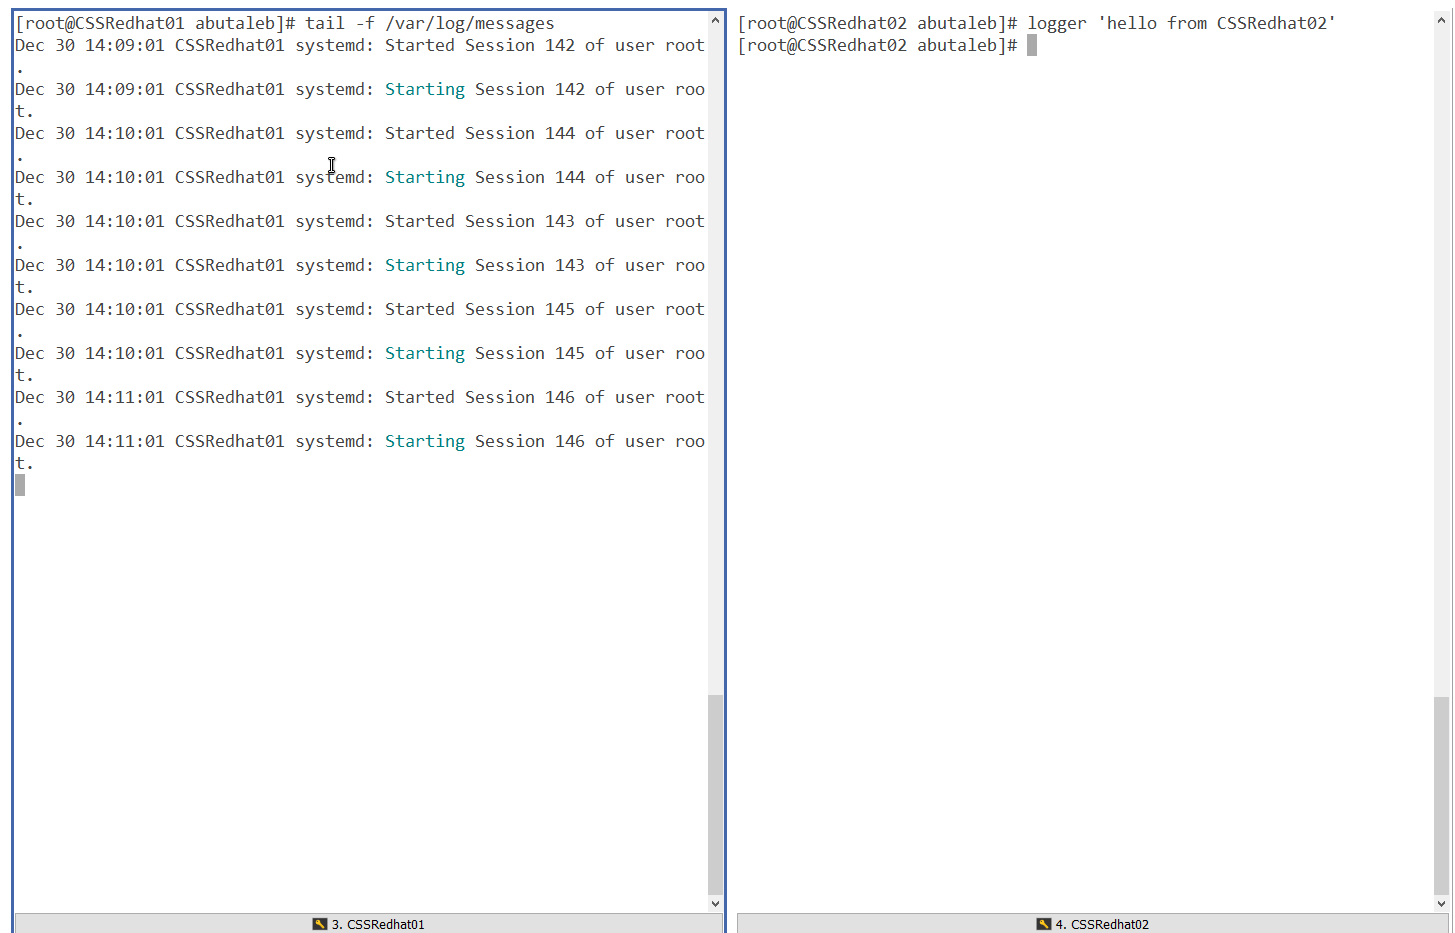
In the above screenshot, we can see that data has not been logged to /var/log/messeges.
We can also try to directly send a test to a remote machine using netcat. This requires nmap to be installed.
you can install nmap with the below:
yum install -y nmapand then test it with the below, placing the exact syslog message between ' '.
echo -n 'Dec 30 14:10:42 CSSRedhat02 abutaleb: hello from CSSRedhat02' | nc -4u -w1 CSSRedhat01 514
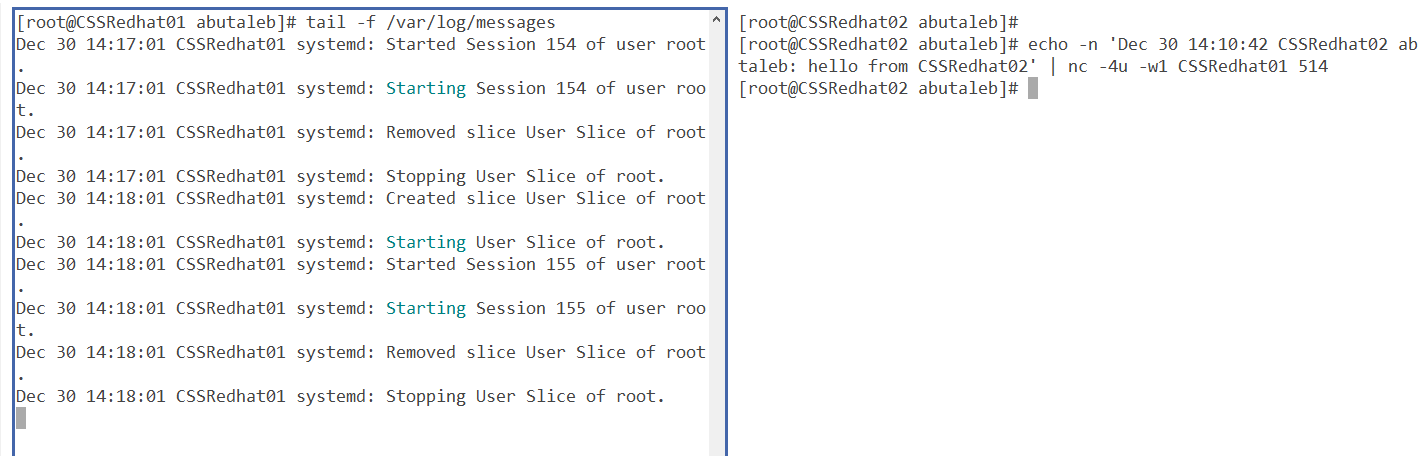
Still the same, so something is blocking the connection, but, we've confirmed using TCPDump that data is being sent from CSSRedhat02 to CSSRedhat01, however, after some research I figured out that tcpdump uses libpcap and libpcap processes packets before they get processed by the firewall.
So our next focus will be the firewall.
Does your local firewall drops the connection ?
Since we are using local connection, data is travelling locally and it is not passing by any firewall such as an NSG..etc and we already saw that data is reaching the server by using TCPDump.
And since tcpdump processes packets before they get processed by the firewall, then our next focus will be the local firewall.
- We can start by checking if the firewall is actually running ?
systemctl is-active firewalld
systemctl is-enabled firewalld
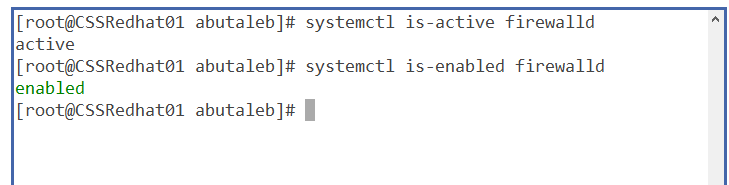
so we can see that yes, it is active and enabled on boot. So is it actually dropping the packets coming on UDP port 514 ?
so let us enable logging on packets dropped by the firewall. To do that, run the below commands.
firewall-cmd --set-log-denied=allThe above will log all denied packets to /var/log/messeges.
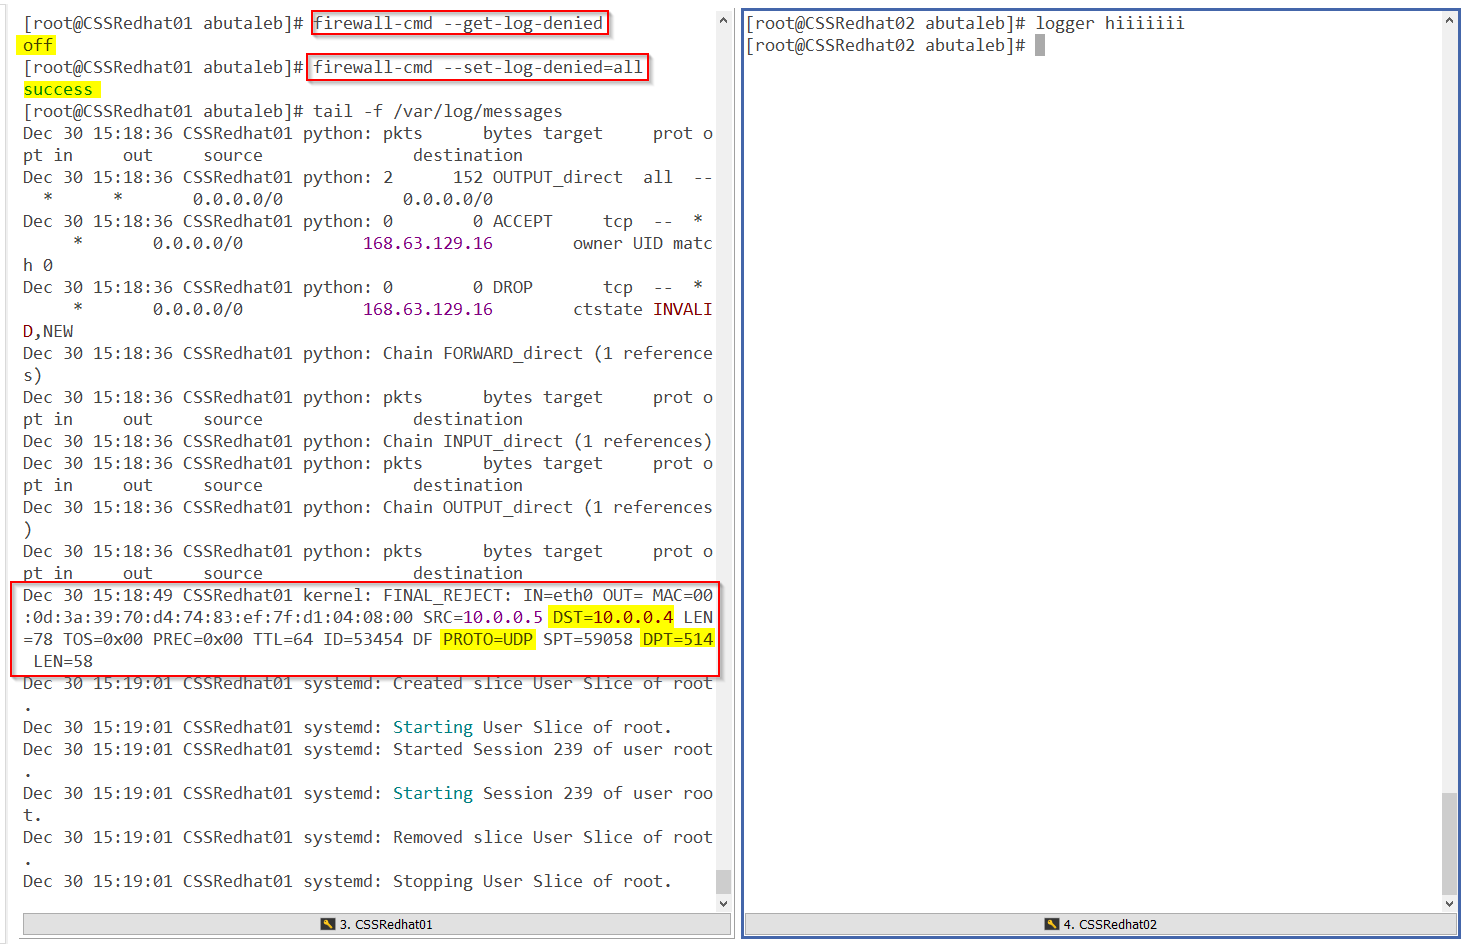
so we can confirm that firewalld is blocking the connection. let us add the rule to enable incoming packets to port 514.
Let us add the rule to allow incoming traffic on port 514 to CSSRedhat01
firewall-cmd --add-port=514/udp
firewall-cmd --runtime-to-permanent
To confirm the port has been added:
firewall-cmd --list-ports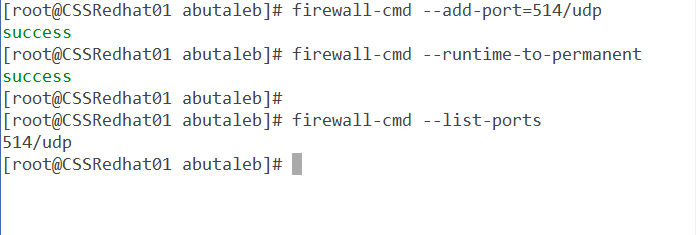
So after allowing the port through the local firewall, let us check if we can see data ?
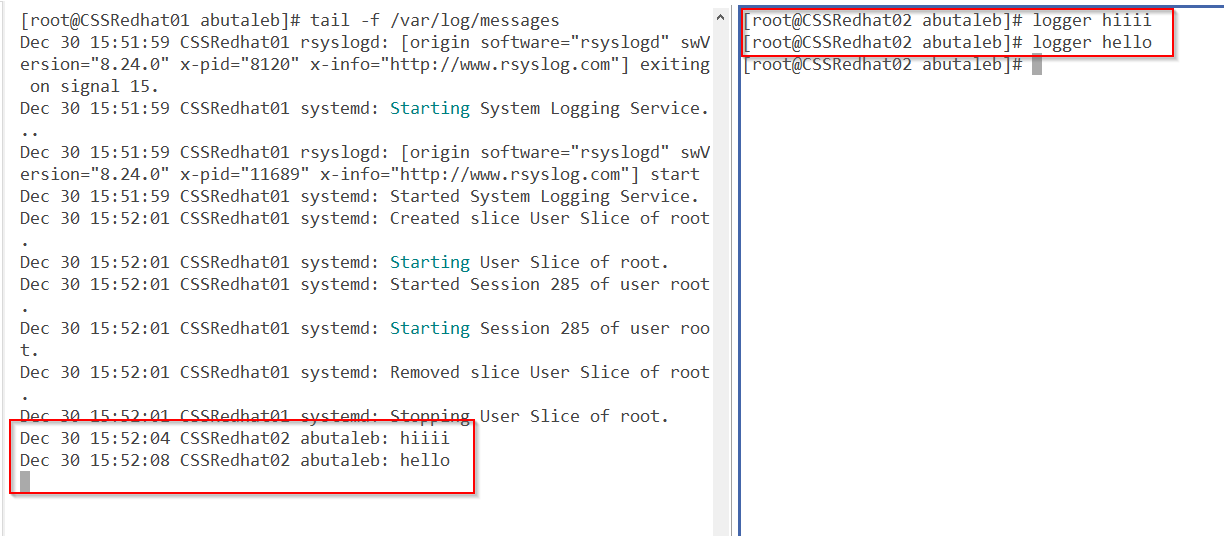
Great! we can see data now.
Do you have SELinux Enabled ?
in my current situation, we are using the default syslog port 514 UDP.
SELinux is only configured to allow sending and receiving on the following ports by default:
yum install -y policycoreutils-python
semanage port -l | grep syslog
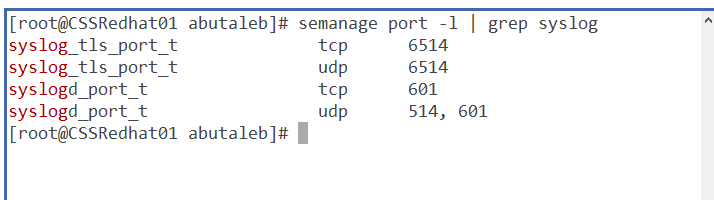
And as we are using port 514/UDP then it will not block our traffic. if you are using a different port, you will need to configure SELinux to Permit rsyslog Traffic on that port.
if for example you are using port 10514, then you can run the below command to allow UDP or TCP on that port.
semanage port -a -t syslogd_port_t -p tcp 10514
semanage port -a -t syslogd_port_t -p udp 10514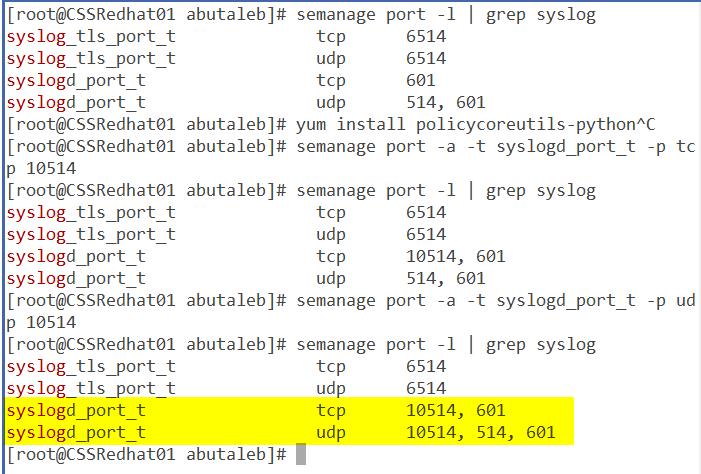
So far we've confirmed that data is being forwarded from CSSRedhat02 to rsyslog on CSSRedhat01. but we still do not see data in log analytics ?
ok so now it is time to check the agent. as we know, when we enable the OMSAgent, it will start listening on port 25224 UDP and this is from the fluentd configuration file located on /etc/opt/microsoft/omsagent/<YourWorkspaceID>/conf/omsagent.d/syslog.conf
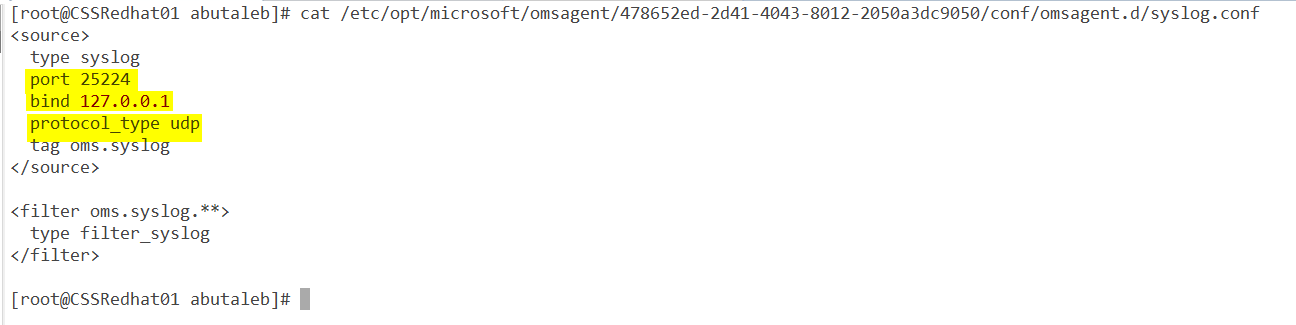
The above configuration is showing us that the OMS syslog plugin is configured to accept events coming from the local host 127.0.0.1 on UDP port 25224. Let us confirm it is actually running ? we can see that by using netstat.
netstat -plntu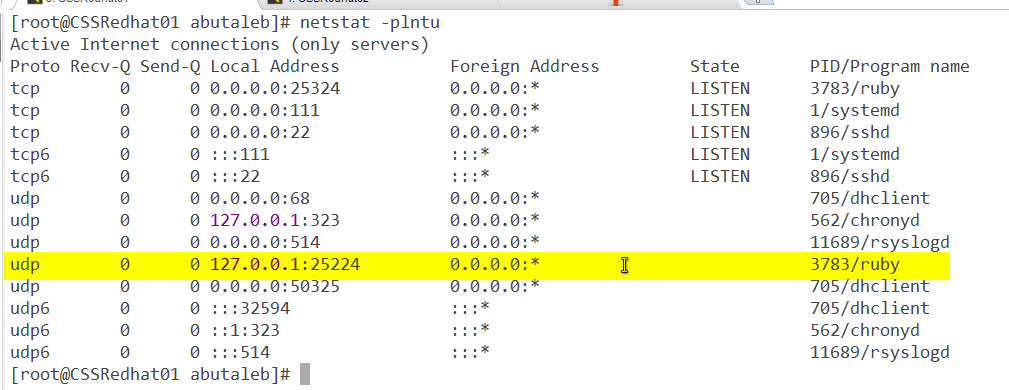
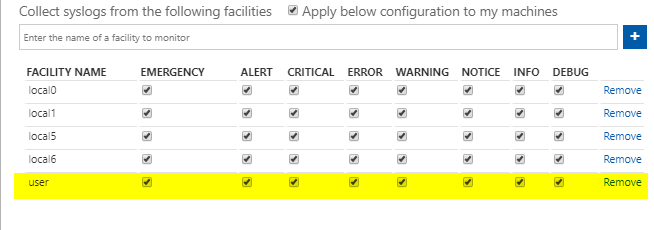
looking back at our diagram, we know that rsyslog will receive data on UDP 514 and then forward it to the OMS plugin on 25224. we can use TCPDump to see if there is data coming from rsyslog to port 25224 from local host.
tcpdump -n udp port 25224 -i lo -vThis time we will change the port to 25224 and the adapter to lo "Loopback" since the data is being sent from 127.0.0.1 "localhost".
So in the above we can see that the data came from outside to 514 but it was not forwarded to 25224. We can also notice that the facility is user, which we did not add.
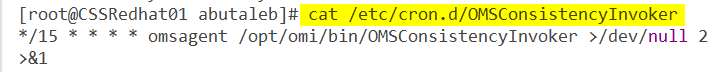
So now let us add the user facility in our workspace.
How to confirm if the facility you added in the workspace is reflected to the agent ?
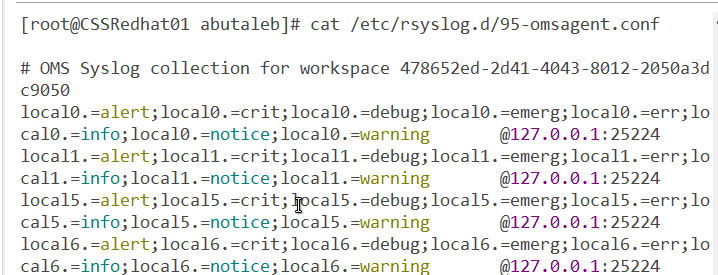
When you add a facility collection in log analytics, it will be added to /etc/rsyslog.d/95-omsagent.conf when the cronjob OMSConsistancyInvoker is triggered, by default, this should be triggered every 15 minutes.
if you do not see the new added facility as below, you can force synchronizing the configurations with the workspace by running the below command:
su - omsagent -c /opt/microsoft/omsconfig/Scripts/PerformRequiredConfigurationChecks.py 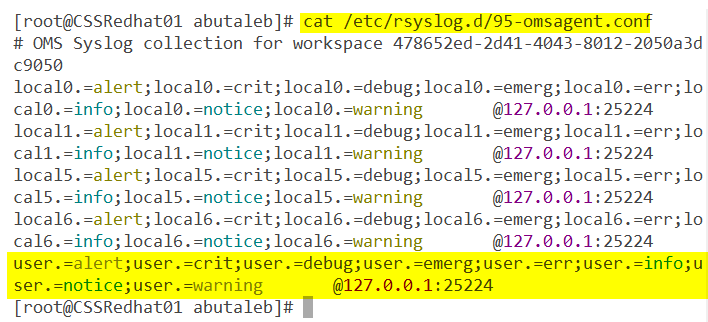
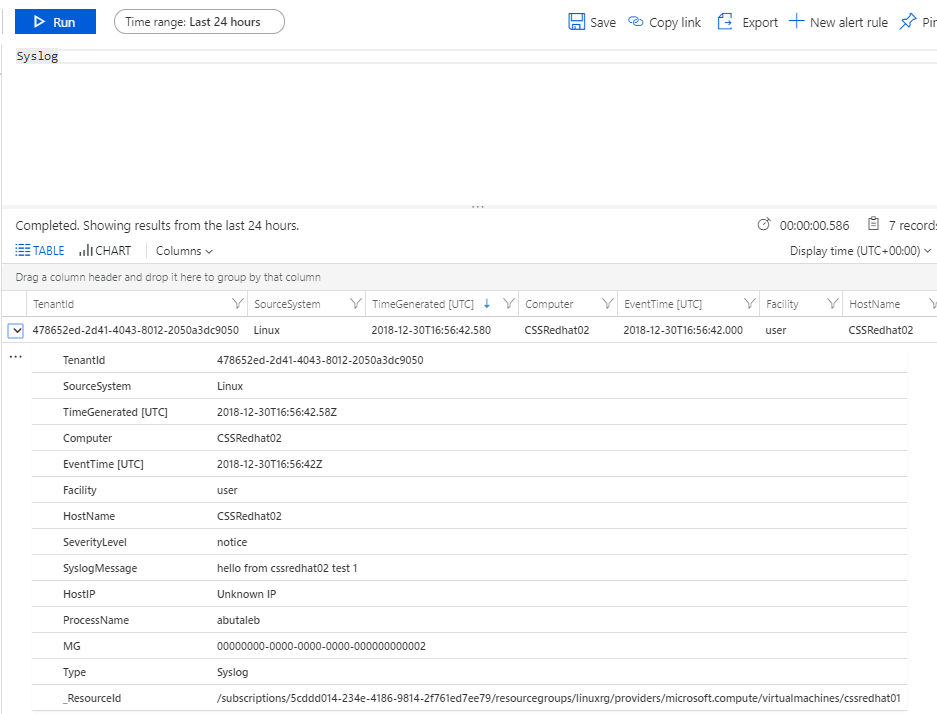
Since we confirmed now that data came from outside to rsyslog, rsyslog forwarded the data to the OMSAgent, facility has been added. let us check the workspace as the diagram, we can now check the workspace and confirm the data is there.
This is the end of Part2. in part 3 we will be configuring and troubleshooting security events for events comming from your firewall/security appliance such as Barracuda, sophos..etc.
if you have any questions, please feel free to drop me a comment below.